There are many functions in R programming for creating 3D plots. In this
section, we will discuss on the persp() function which can be
used to create 3D surfaces in perspective view.
This function mainly takes in three variables, x,
y and z where x and y are
vectors defining the
location along x- and y-axis. The height of the surface (z-axis) will be in
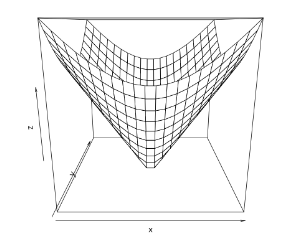
the matrix z. As an example,
Let's plot a cone. A simple right circular cone can be obtained with the following function.
cone <- function(x, y){
sqrt(x^2+y^2)
}
Now let's prepare our variables.
x <- y <- seq(-1, 1, length= 20)
z <- outer(x, y, cone)
We used the function seq() to generate vector of equally spaced
numbers.
Then, we used the outer() function to apply the function
cone at every combination of x and y.
Finally, plot the 3D surface as follows.
persp(x, y, z)

Adding Titles and Labeling Axes to Plot
We can add a title to our plot with the parameter main.
Similarly, xlab, ylab and zlab can be
used to label the three axes.
Rotational angles
We can define the viewing direction using parameters theta and
phi.
By default theta, azimuthal direction, is 0 and phi,
colatitude direction, is 15.
Coloring and Shading Plot
Coloring of the plot is done with parameter col.
Similarly, we can add shading with the parameter shade.
persp(x, y, z,
main="Perspective Plot of a Cone",
zlab = "Height",
theta = 30, phi = 15,
col = "springgreen", shade = 0.5)